Market Snapshot is a free service I provide for my clients. The charts and tables below are from the statistics from April 29th, 2010 for the Siesta Key Area (34242). The criterion was based on a 3 bedroom 2 bathroom homes between $250,000 and $300,000. Once registered you will receive a report monthly on your area.
Where is the home and market information for this Market Snapshot collected from?
The information comes from the local Multiple Listings Service (MLS) database, your area’s primary source of real estate listing, transaction and market data. The complete MLS database is only accessible to real estate professionals.
Unlike other sources (like Public Records, which only provide data on Sold Homes), the MLS provides detailed information on homes that have sold, homes currently for sale, homes under contract but not yet closed (pending sales), and homes that didn’t sell (cancelled or expired listings). Additionally, the MLS offers analysis of various market trends. So you can be sure that the home and market information I provide to you is the most comprehensive, accurate and up-to-date available.
How does this Market Snapshot compare to other home evaluation services?
Other services may provide a generalized, estimated market evaluation of an average home that has the same basic characteristics as your home. However, such an estimate is only one of many pieces of information you’ll need to make the most informed decisions you can when selling your home. Real-Time Market Snapshots also include graphical analysis of important market trends that will place your home evaluation into perspective. These Snapshots give you:
- Real-time data on homes similar to yours in your area that have recently sold or are currently for sale
- How long specific homes were on the market before they sold, as well as time-on-the-market averages for your area
- Volume comparisons of recent sales, new listings and total listings
- Percentages comparison of asking price to selling price for recent sales
- Average, median and high/low prices for homes that have recently sold or are currently for sale
This additional information is crucial in helping to price, position and market your home so that you get top dollar when you sell.
What information do the Market Snapshot maps and graphs include?
The map area displays your home address (if you are using the Snapshot to calculate the value of your home) or your chosen area of interest (if you are using the snapshot to investigate an area with a mind towards buying) and all the properties found in the area which match the criteria you specified.
Beneath the map, a scrolling grid listing all of the properties used to generate the report’s statistics. Then you can choose to show a road map, an aerial (or “satellite”) view, or a hybrid view with both the aerial and the road map. In addition, you can select a “bird’s eye” view which displays an angled aerial perspective, rather than the “straight down” perspective offered by the conventional aerial view.

Siesta Key Map of Listed vs. Sold April 2010
Next to the map area is an accordion control that contains graphs and statistics based on the properties displayed on the map. The Market accordion control contains the following views:
- Asking and Sold Prices: Open this part of the control to view a chart which charts the asking and selling prices of the properties that sold within the time span selected from the View Home Prices and Time on Market for drop-down control.
- Asking vs. Selling Price: This part of the control deals exclusively with properties that have actually sold. A bar graph displays the contrast between asking and selling prices for properties sold within the selected time span.
- Time on Market: This view contains information about both currently listed and sold properties. A graph displays high/low days and time on market as linear information, with sold properties marked according to selling price and date within the selected time period.
- Number of Homes: This view breaks down the active listings into newly listed properties and existing listed properties and charts their relationship throughout the time span selected.
How are the numbers calculated in the tables of statistic for each chart?
Each view of the accordion control contains a table summarizing the chart’s contents. The contents of the tables are calculated based on the listed and sold properties found within the selected date range (Last 3 Months, Last 30 Days, This Week). The following statistics are available.
- Asking and Sold Prices: This view features a table displaying the following statistics for sold and listed properties: total found, most recent, highest price, lowest price, average price, median price.
- Asking vs. Selling Price: This view displays the average percentage of asking price received, the number of sales which exceeded the asking price, the number which sold for less than the asking price, and the number that sold for exactly the asking price.
- Time on Market: This view features a table displaying the following statistics for sold and listed properties: total number of properties, average days on market, most recent listing/sale, shorts days on market, longest days on market.
- Number of Homes: This view features statistics on the number of sales in the time period, number of new listings in the time period, and average number of homes for sale on any given day within the time period.
How is the market information in the Market Snapshot relevant to me and my home?
In many ways! In the Asking and Sold Prices view, the Asking Prices and Sold Prices graph depicts the average price and the high/low price of homes for sale in your area that are similar to yours. The graph also depicts the selling price of homes similar to yours that have recently sold. This graph gives you a general indication of what the prices of homes like yours have been doing in the time frame you selected.

Siesta Key Asking and Sold Prices April 2010
In the Asking vs. Selling Price view, the graph the prices that sellers originally ask for their homes with the prices they actually get when their homes sell. Note that if the selling price is equal to or more than the asking price, then you might be in a sellers’ market and it will generally be easier to sell your home for the price you ask. If the selling price is considerably less than the asking price, then you might be in a buyers’ market and it will generally be more difficult to sell your home for the price you ask.

Siesta Key Asking vs. Selling Price April 2010
The Time on Market view depicts the average number of days that homes similar to yours were on the market before they sold. The graph also depicts both the most and least number of days that homes similar to yours were on the market before they sold. Note that the lower the average days-on-the-market, the more it is a sellers’ market and it will generally be easier to sell your home for the price you ask. The greater the average days-on-the-market, the more it is a buyers’ market and it will generally be more difficult to sell your home for the price you ask.
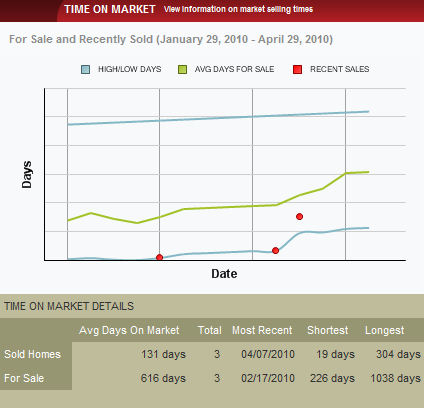
Siesta Key Time on the Market April 2010
Finally, the Number of Homes view compares the number of homes similar to yours that have recently been put up for sale, the number that have recently sold and the total number of homes for sale. Note that if recent sales considerably outnumber recent listings you could be in a sellers’ market and if recent listings considerably outnumber recent sales you could be in a buyers’ market.

Siesta Key Homes for Sale vs. Sold April 2010
What is my next step if I am considering selling my home?
The information provided here is meant to give you a general picture of what the real estate market is doing in your area. If you’d like more detailed market information and my analysis of it, or if you’d like a very precise evaluation of your home’s current market value, please contact me.
Additionally, if you’d like to know how you can get the highest possible price for your home when you decide to sell, or if you have any real estate related questions at all, I’d be happy to help you. Contact me at (941) 421-7375 or wendy@sunnysarasotahomes.com . To Get your FREE report and see what the value of your Sarasota, Bradenton, Lakewood Ranch, or Siesta Key home is click on my Market Snapshot Page!


