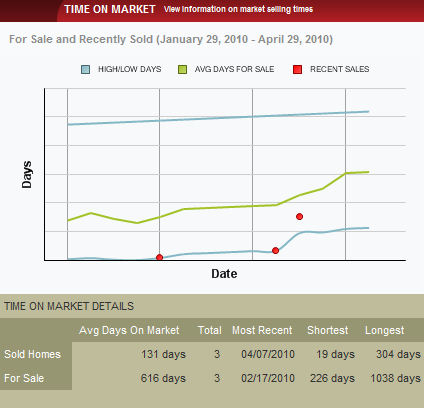
The Time on Market view depicts the average number of days that homes similar to yours were on the market before they sold. The graph also depicts both the most and least number of days that homes similar to yours were on the market before they sold. Note that the lower the average days-on-the-market, the more it is a sellers’ market and it will generally be easier to sell your home for the price you ask. The greater the average days-on-the-market, the more it is a buyers’ market and it will generally be more difficult to sell your home for the price you ask.


